- toc
{:toc}
Cppcheck
Cppcheck is a static analysis tool for C/C++ code.
Unlike C/C++ compilers and many other analysis tools it does not detect syntax errors in the code.
Cppcheck primarily detects the types of bugs that the compilers normally do not detect.
The goal is to detect only real errors in the code (i.e. have zero false positives).
安装:
sudo apt-get install cppcheck cppcheck-gui用法:
cppcheck-gui

cppcheck -h

# Recursively check the current folder. Print the progress on the screen and
# write errors to a file:
cppcheck . 2> err.txt

# Recursively check ../myproject/ and don't print progress:
cppcheck --quiet ../myproject/

# Check test.cpp, enable all checks:
cppcheck --enable=all --inconclusive --std=posix test.cpp

# Check f.cpp and search include files from inc1/ and inc2/:
cppcheck -I inc1/ -I inc2/ f.cpp
Understand
Understand® is an IDE built from the ground up to help you fully comprehend your source code. Analyze it, measure it, visualize it, maintain it - Understand it.
Understand软件的功能主要定位于代码的阅读理解。
具备如下特性:
- 支持多语言:Ada, C, C++, C#, Java, FORTRAN, Delphi, Jovial, and PL/M ,混合语言的project也支持
- 多平台: Windows/Linux/Solaris/HP-UX/IRIX/MAC OS X
- 代码语法高亮、代码折叠、交叉跳转、书签等基本阅读功能。
- 可以对整个project的architecture、metrics进行分析并输出报表。
- 可以对代码生成多种图(butterfly graph、call graph、called by graph、control flow graph、UML class graph等),
在图上点击节点可以跳转到对应的源代码位置。 - 提供Perl API便于扩展。作图全部是用Perl插件实现的,直接读取分析好的数据库作图。
- 内置的目录和文件比较器。
- 支持project的snapshot,并能和自家的TrackBack集成便于监视project的变化。
valgrind
- valgrind
- Alleyoop
- Valkyrie
- Valgrind User Manual
- Valgrind’s Tool Suite
- C语言代码检测:valgrind的使用
- 应用 Valgrind 发现 Linux 程序的内存问题
- 如何使用Valgrind memcheck工具进行C/C++的内存泄漏检测
Valgrind是一套Linux下,开放源代码(GPL V2)的仿真调试工具的集合。
Valgrind由内核(core)以及基于内核的其他调试工具组成。
内核类似于一个框架(framework),它模拟了一个CPU环境,并提供服务给其他工具;
而其他工具则类似于插件 (plug-in),利用内核提供的服务完成各种特定的内存调试任务。
它支持 C/C++,支持各类 Unix 系统。
安装:
sudo apt-get install valgrind工具集:
- Memcheck。这是valgrind应用最广泛的工具,一个重量级的内存检查器,
能够发现开发中绝大多数内存错误使用情况,
比如:使用未初始化的内存,使用已经释放了的内存,内存访问越界等。 - Callgrind。它主要用来检查程序中函数调用过程中出现的问题。
- Cachegrind。它主要用来检查程序中缓存使用出现的问题。它与Cachegrind的功能有重叠,但也收集Cachegrind不收集的一些信息。
- Helgrind。它主要用来检查多线程程序中出现的竞争问题。
- Massif。它主要用来检查程序中堆栈使用中出现的问题。它有助于使你的程序使用更少的内存。
- DRD也是一个线程错误检测器。它和Helgrind相似,但使用不同的分析技术,所以可能找到不同的问题。
编译选项使用-g -O0, 交叉编译之后在目标机上执行内存检测:
valgrind --tool=memcheck --leak-check=full ./a.out
==2888== Memcheck, a memory error detector
==2888== Copyright (C) 2002-2009, and GNU GPL'd, by Julian Seward et al.
==2888== Using Valgrind-3.6.0.SVN-Debian and LibVEX; rerun with -h for copyright info
==2888== Command: ./val
==2888==

[a]
==2888==
==2888== HEAP SUMMARY:
==2888==     in use at exit: 1 bytes in 1 blocks
==2888==   total heap usage: 1 allocs, 0 frees, 1 bytes allocated
==2888==
==2888== 1 bytes in 1 blocks are definitely lost in loss record 1 of 1
==2888==    at 0x4C274A8: malloc (vg_replace_malloc.c:236)
==2888==    by 0x400575: main (valgrind.c:6)
==2888==
==2888== LEAK SUMMARY:
==2888==    definitely lost: 1 bytes in 1 blocks
==2888==    indirectly lost: 0 bytes in 0 blocks
==2888==      possibly lost: 0 bytes in 0 blocks
==2888==    still reachable: 0 bytes in 0 blocks
==2888==         suppressed: 0 bytes in 0 blocks
==2888==
==2888== For counts of detected and suppressed errors, rerun with: -v
==2888== ERROR SUMMARY: 1 errors from 1 contexts (suppressed: 4 from 4)
memcheck可以检测下列与内存相关的问题 :
- 未释放内存的使用
- 对释放后内存的读/写
- 对已分配内存块尾部的读/写
- 内存泄露
- 不匹配的使用malloc/new/new[] 和 free/delete/delete[]
- 重复释放内存
KCachegrind
安装:
sudo apt-get install kcachegrindvalgrind安装之后有工具callgrind,使用此工具生成性能日志,使用kcachegrind进行分析:
/data/test  > gcc -g -O0 main.c -o perf
/data/test  > valgrind --tool=callgrind ./perf
==27075== Callgrind, a call-graph generating cache profiler
==27075== Copyright (C) 2002-2015, and GNU GPL'd, by Josef Weidendorfer et al.
==27075== Using Valgrind-3.11.0 and LibVEX; rerun with -h for copyright info
==27075== Command: ./perf
==27075==
==27075== For interactive control, run 'callgrind_control -h'.
hello world!
hello world!
hello world!
test
hello world!
test
hello world!
test
==27075==
==27075== Events    : Ir
==27075== Collected : 155985
==27075==
==27075== I   refs:      155,985
/data/test  > ls
1  a.out  callgrind.out.27075  main.c  output  perf  photorec.ses  recup_dir.1  rgb  testdisk.log
/data/test > kcachegrind callgrind.out.27075 
在Call Graph中,你能看到每一个函数的开销百分比包括Inclusive,即涵带子函数的总开销和Self,函数自己的开销,
另外每一个函数的调用次数也列写在上面。
也可以分析出函数的调用关系和流程,这是一个非常好的辅助工具,帮助你快速理解系统的工作流Work Flow。
gprof
- gprof
- GPROF Tutorial – How to use Linux GNU GCC Profiling Tool
- GNU gprof
- 使用 GNU profiler 来提高代码运行速度
- GNU–gprof使用总结
Gprof 是GNU gnu binutils工具之一,默认情况下linux系统当中都带有这个工具:
- 可以显示“flat profile”,包括每个函数的调用次数,每个函数消耗的处理器时间,
- 可以显示“Call graph”,包括函数的调用关系,每个函数调用花费了多少时间。
- 可以显示“注释的源代码”--是程序源代码的一个复本,标记有程序中每行代码的执行次数。
Gprof基本用法:
- 使用
-pg编译和链接你的应用程序。 - 执行你的应用程序使之生成供gprof 分析的数据。
- 使用gprof 程序分析你的应用程序生成的数据。
gcc gprof.c -pg -o example1 -O0 -g
./example1
✔ /data/test  > ls gmon.out
gmon.out

# flat profile
gprof example1 gmon.out -p
Flat profile:

Each sample counts as 0.01 seconds.
%   cumulative   self              self     total
time   seconds   seconds    calls  ms/call  ms/call  name
50.43      0.01     0.01        3     3.36     3.36  count_sum
50.43      0.02     0.01        1    10.09    13.45  my_print2
0.00      0.02     0.00        2     0.00     3.36  my_print

# call graph
gprof example1 gmon.out -q

# gprof - display call graph profile data
man gprof
带注解的源代码
如果希望获得一个 “带注解的源代码” 清单,它会将源代码输出到应用程序中,并加上每个函数被调用了多少次的注释。
要使用这种功能,请使用启用调试功能的标志来编译源代码,这样源代码就会被加入可执行程序中:
gcc example1.c -g -pg -o example1 -O2 -lc像以前一样重新运行这个应用程序:
./example1 50000gprof 命令现在应该是:
gprof example1 gmon.out -A常用参数
- -b 不再输出统计图表中每个字段的详细描述。
- -p 只输出函数的调用图(Call graph的那部分信息)。
- -q 只输出函数的时间消耗列表。
- -e Name 不再输出函数Name 及其子函数的调用图(除非它们有未被限制的其它父函数)。可以给定多个 -e 标志。一个 -e 标志只能指定一个函数。
- -E Name 不再输出函数Name 及其子函数的调用图,此标志类似于 -e 标志,但它在总时间和百分比时间的计算中排除了由函数Name 及其子函数所用的时间。
- -f Name 输出函数Name 及其子函数的调用图。可以指定多个 -f 标志。一个 -f 标志只能指定一个函数。
- -F Name 输出函数Name 及其子函数的调用图,它类似于 -f 标志,但它在总时间和百分比时间计算中仅使用所打印的例程的时间。可以指定多个 -F 标志。一个 -F 标志只能指定一个函数。-F 标志覆盖 -E 标志。
- -z 显示使用次数为零的例程(按照调用计数和累积时间计算)。
用户时间与内核时间
gprof 的最大缺陷:它只能分析应用程序在运行过程中所消耗掉的用户时间,无法得到程序内核空间的运行时间。通常来说,应用程序在运行时既要花费一些时间来运行用户代码,也要花费一些时间来运行 “系统代码”,例如内核系统调用sleep()。
有一个方法可以查看应用程序的运行时间组成,在 time 命令下面执行程序。这个命令会显示一个应用程序的实际运行时间、用户空间运行时间、内核空间运行时间。
✔ /data/test  > time ./example1
./example1  0.02s user 0.00s system 93% cpu 0.026 total
注意事项
- g++在编译和链接两个过程,都要使用-pg选项。
- 只能使用静态连接libc库,否则在初始化
*.so之前就调用profile代码会引起“segmentation fault”,
解决办法是编译时加上-static-libgcc或-static。 - 如果不用g++而使用ld直接链接程序,要加上链接文件/lib/gcrt0.o,如ld -o myprog /lib/gcrt0.o myprog.o utils.o -lc_p。
也可能是gcrt1.o - 要监控到第三方库函数的执行时间,第三方库也必须是添加 –pg 选项编译的。
- gprof只能分析应用程序所消耗掉的用户时间.
- 程序不能以demon方式运行。否则采集不到时间。(可采集到调用次数)
- 首先使用 time 来运行程序从而判断 gprof 是否能产生有用信息是个好方法。
- 如果 gprof 不适合您的剖析需要,那么还有其他一些工具可以克服 gprof 部分缺陷,包括 OProfile 和 Sysprof。
- gprof对于代码大部分是用户空间的CPU密集型的程序用处明显。
对于大部分时间运行在内核空间或者由于外部因素(例如操作系统的 I/O 子系统过载)而运行得非常慢的程序难以进行优化。 - gprof 不支持多线程应用,多线程下只能采集主线程性能数据。原因是gprof采用ITIMER_PROF信号,在多线程内只有主线程才能响应该信号。
但是有一个简单的方法可以解决这一问题 - gprof只能在程序正常结束退出之后才能生成报告(gmon.out)。
- gprof通过在atexit()里注册了一个函数来产生结果信息,任何非正常退出都不会执行atexit()的动作,所以不会产生gmon.out文件。
- 程序可从main函数中正常退出,或者通过系统调用exit()函数退出。
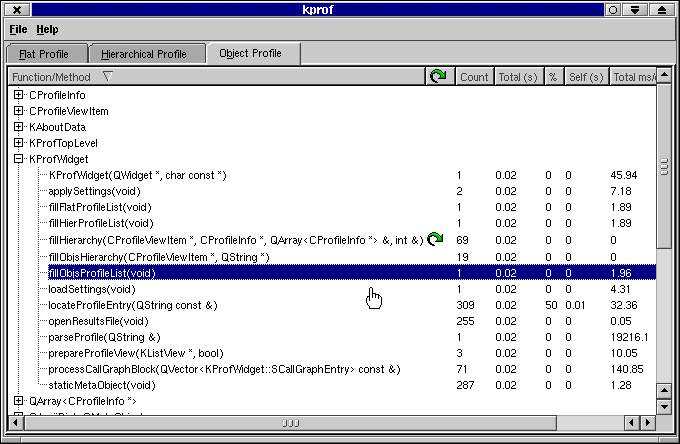
KProf
KProf - Profiling made easy
将gprof , GUI化了,更加友好,它也利用graphviz绘制运行时流程图,但是对于大的程序,似乎效果不太好,流程图感觉完全乱掉了

gprof2dot
sudo apt-get install python graphviz
git clone https://github.com/jrfonseca/gprof2dot.git
python setup.py build
sudo python steup.py install
用法:
gcc -pg linpack.c -o linpack_gprof
gprof ./linpack_gprof | python2.7 gprof2dot.py -n0 -e0 |dot - Tpng -o output.png
还可通过以下命令得到函数调用图:
gprof linpack_gprof > prof.log
./gprof2dot.py prof.log | dot -Tpng -o output.png 
通过对比以上两种方法,可以发现第二种方法无法得到调用时间过短的函数调用关系
gprof2dot默认是部分函数调用图,对性能影响不大的函数调用都不显示,例如上图中没有出现类的构造,析构函数,
如果想要显示全部的函数调用,可以 gprof2dot -n0 -e0 ,默认是n0.5即影响小于5%的函数就不显示了。
当然这样图片会很乱,因为显示内容很多,可以 gprof2dot -n0 -e0 -s #-s表示不显示诸如模板,函数入口参数等等,使得
函数名称显示更加精简。
dot用于生成图片,使用xdot.py不需要生成图片,直接交互
gprof ./linpack_gprof | python2.7 gprof2dot.py -n0 -e0 | ./xdot.pypython环境变量设置有问题,xdot单独可以工作,使用管道不能正常工作
function showCall()
{
    gprof $1 | python3 /data/Installer/gprof2dot/gprof2dot.py > /tmp/__call_tmp
    xdot /tmp/__call_tmp
    rm /tmp/__call_tmp
}
gperftools
在Linux的C/C++编程的世界里,性能调优一直是个让人头疼的事。
最出名的gprof虽然大家都知道, 其用法比较单一(只支持程序从启动到结束的profile),
而且对程序的运行时间会有比较大的影响, 所以其profile不一定准确。
而valgrind功能十分强大,但profile也一般针对整个程序的运行,很难只对程序运行中的某段时间进行profile。
而且也多少会影响程序的运行,且使用的难度也较大。
如何profile
在gperftools的文档中,就简单的说了下面的方式来进行profile:
gcc [...] -o myprogram -lprofiler
CPUPROFILE=/tmp/profile ./myprogram
是的,在编译和安装了gperftools之后,只需要上面的步骤就可以进行profile了,非常简单。
而profile的结果就保存在/tmp/profile。查看结果只需要用gperftools自带的一个pprof脚本来看就可以:
$ pprof --text ./myprogram /tmp/profile
14   2.1%  17.2%       58   8.7% std::_Rb_tree::find
pprof的输出也很直观,不过也还不够好,从这个输出中还不好看出调用关系,包括caller和callee。
而pprof也可以输出图示,还可以输出callgrind兼容的格式,这样就可以用kcachegrind来看profile结果了。
$ pprof --callgrind ./myprogram /tmp/profile > callgrind.res然后利用kcachegrind打开这个callgrind.res文件
动态profile
上面说到的方式是通过环境变量来触发profile,而跨度也是整个程序的生命周期。
那如果是想要在程序运行的某段时间进行profile呢?如果我想在程序不结束的情况下就拿到profile的结果呢?
这种情况下就需要用到动态profile的方式了。要实现这种方式,就需要改动程序的代码了,不过也比较简单:
#include <gperftools/profiler.h>

int main()
{
    ProfilerStart("/tmp/profile");
    some_func_to_profile();
    ProfilerStop();

    return 0;
}没错,你只需要在你想要profile的函数的开头和结尾加上ProfilerStart和ProfilerStop调用就可以了。
在ProfilerStop结束之后,profile的结果就会保存在/tmp/profile里面了。
利用这种方式就可以在指定的时间点对程序进行profile了。
最后需要说的一点是,gperftools的profile过程采用的是采样的方式,而且对profile中的程序性能影响极小,
这对于在线或者离线profile都是一个极其重要的特点。
include-what-you-use
首先安装CLang开发包,然后编译IWYU:
sudo apt-get install llvm llvm-devel llvm-clang llvm-clang-devel
git clone https://github.com/include-what-you-use/include-what-you-use.git
mkdir build && cd build
cmake -G "Unix Makefiles" -DIWYU_LLVM_ROOT_PATH=/usr/lib/llvm-3.8 ../../include-what-you-use
make
使用:
make -k CC=/data/OpenSourceCode/include-what-you-use/build/include-what-you-use -I/usr/lib/llvm-3.8/lib/clang/3.8.0/include

-e compiling [/data/OpenSourceCode/include-what-you-use/build/include-what-you-use]: ./ca/thinew/app_tnt_baseinfo.c
In file included from ca/thinew/app_tnt_baseinfo.c:19:
In file included from ./include/app_module.h:22:
In file included from ./include/module/app_play_control.h:22:
In file included from /home/workspace/Solution-for-debug/dishcas/solution/../library/goxceed/csky-ecos/include/gxcore.h:4:
In file included from /home/workspace/Solution-for-debug/dishcas/solution/../library/goxceed/csky-ecos/include/common/gxcore_common.h:4:
In file included from /home/workspace/Solution-for-debug/dishcas/solution/../library/goxceed/csky-ecos/include/stdlib.h:70:
/home/workspace/Solution-for-debug/dishcas/solution/../library/goxceed/csky-ecos/include/stddef.h:63:15: fatal error:
    'stddef.h' file not found
#include_next <stddef.h>
^

ca/thinew/app_tnt_baseinfo.c should add these lines:

ca/thinew/app_tnt_baseinfo.c should remove these lines:
- #include "app_module.h"  // lines 19-19

The full include-list for ca/thinew/app_tnt_baseinfo.c:
#include "app_config.h"  // for TNTCAS_SUPPORT
---
deps:17: recipe for target '/home/workspace/Solution-for-debug/dishcas/solution/output/objects/app_tnt_baseinfo.o' failed
make[1]: *** [/home/workspace/Solution-for-debug/dishcas/solution/output/objects/app_tnt_baseinfo.o] Error 3
fatal error: ‘stddef.h’ file not found待排除,可能与CLang环境设置有关,或与
include_next有关
How to Install
可以将 IWYU 保存到文件中,之后使用其附带的 fix_includes.py 自动对代码进行修复。 但应该慎重….
$ make -B -k CXX=include-what-you-use > iwyu.out
$ fix_includes.py < iwyu.out
OCLint
- OCLint
- The OCLint Static Code Analysis Tool
- OCLint 安装与使用
- 代码度量:帮助写出高质量代码的工具
- oc代码静态检查方案
- Building OCLint
- Installation
- downloading pre-compiled binaries
下载预编译版本,然后将PATH添加到.zshrc中,测试如下:
oclint
oclint: Not enough positional command line arguments specified!
Must specify at least 1 positional arguments: See: oclint -help如果使用make来构建系统,使用方式如下:
sudo apt-get install bear

#compile_commands.json
bear make

#oclint-json-compilation-database for code analysis
oclint-json-compilation-database

oclint -p <build path> <source0> [... <sourceN>]
OCLint配置规则
Clang Static Analyzer
在编译安装 llvm/clang 或者 sudo apt-get install clang 之后,scan-build 和 scan-view 分别在
$(SRC)/llvm/tools/clang/tools/scan-build
$(SRC)/llvm/tools/clang/tools/scan-view
使用:
scan-build make
.
scan-build: 3 bugs found.
scan-build: Run 'scan-view /tmp/scan-build-2016-06-23-124956-25166-1' to examine bug reports.
scan-view /tmp/scan-build-2016-06-23-124956-25166-1
checker – 检查规则
内置的 checker 存放在 $(SRC)/llvm/tools/clang/lib/StaticAnalyzer/Checkers 目录下。
这些 checker 默认情况下并没有全部开启,所以需要根据情况启用合适的 checker。
可以使用 -enable-checker 和 -disable-checker 开启和禁用具体的 checker 或者 某种类别的 checker。
$ scan-build -enable-checker alpha.security.ArrayBoundV2 make # 启用数组边界检查所有支持的 checkers 可以使用如下命令查看:
$ clang -cc1 -analyzer-checker-help
alpha.core.BoolAssignment       Warn about assigning non-{0,1} values to Boolean variables
alpha.core.CastSize             Check when casting a malloced type T, whether the size is a multiple of the size of T
alpha.core.CastToStruct         Check for cast from non-struct pointer to struct pointer
alpha.core.FixedAddr            Check for assignment of a fixed address to a pointer
alpha.core.IdenticalExpr        Warn about unintended use of identical expressions in operators
alpha.core.PointerArithm        Check for pointer arithmetic on locations other than array elements
alpha.core.PointerSub           Check for pointer subtractions on two pointers pointing to different memory chunks
alpha.core.SizeofPtr            Warn about unintended use of sizeof() on pointer expressions
alpha.cplusplus.NewDeleteLeaks  Check for memory leaks. Traces memory managed by new/delete.
alpha.cplusplus.VirtualCall     Check virtual function calls during construction or destruction
...
alpha.security.ArrayBound       Warn about buffer overflows (older checker)
alpha.security.ArrayBoundV2     Warn about buffer overflows (newer checker)
alpha.security.MallocOverflow   Check for overflows in the arguments to malloc()
alpha.security.ReturnPtrRange   Check for an out-of-bound pointer being returned to callers
...
core.CallAndMessage             Check for logical errors for function calls and Objective-C message expressions (e.g., uninitialized arguments, null function pointers)
core.DivideZero                 Check for division by zero
core.DynamicTypePropagation     Generate dynamic type information
core.NonNullParamChecker        Check for null pointers passed as arguments to a function whose arguments are references or marked with the 'nonnull' attribute
core.NullDereference            Check for dereferences of null pointers
core.StackAddressEscape         Check that addresses to stack memory do not escape the function
...
unix.API                        Check calls to various UNIX/Posix functions
unix.Malloc                     Check for memory leaks, double free, and use-after-free problems. Traces memory managed by malloc()/free().
unix.MallocSizeof               Check for dubious malloc arguments involving sizeof
unix.MismatchedDeallocator      Check for mismatched deallocators.
unix.cstring.BadSizeArg         Check the size argument passed into C string functions for common erroneous patterns
unix.cstring.NullArg            Check for null pointers being passed as arguments to C string functions
在使用 -enable-checker 或者 -disable-checker 时,不需要完整的指定某个 checker 的名称, 也可以是某一类的,如:
$ scan-build -enable-checker alpha ...
$ scan-build -enable-checker alpha.security ...
例如:
$ scan-build -enable-checker alpha.security make
-e compiling [/usr/share/clang/scan-build-3.8/bin/../libexec/ccc-analyzer]: ./channel_edit.c
channel_edit.c:202:15: warning: Value stored to 'data' during its initialization is never read
    list_data data = {0};
            ^~~~   ~~~
1 warning generated.
scan-build: 150 bugs found.
scan-build: Run 'scan-view /tmp/scan-build-2016-06-23-125458-27549-1' to examine bug reports.

# scan-view-3.8 ImportError: No module named ScanView
$ scan-view-3.4 /tmp/scan-build-2016-06-23-125458-27549-1
相比 cppcheck,它提供了更多的检查规则。
Purify
Infer
Facebook 的 Infer 是一个静态分析工具。Infer 可以分析 Objective-C, Java 或者 C 代码,报告潜在的问题。